 Get GNU / Linux
 News Feed
 Blogs
Blogs Event Photos
 Screen Shots
 Polls
Polls Popular Content
 Members
 Search
 Wall Papers
I just noticed that we passed the 1000 nodes milestone, I suppose thats a long way for our website.
is anyone wondering about the rate by which eglug is growing?
I made a crude plot of eglug's growth with time using.
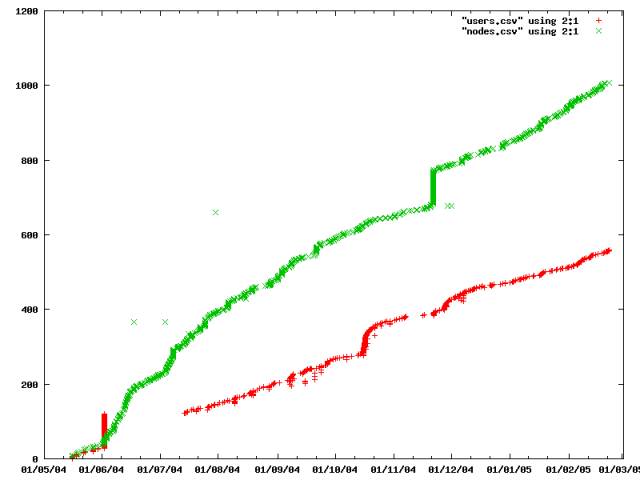
green is for nodes and red is for users.
what do you make of it?
even though the growth is steady our active members are still among the first 200 (most among the first 100 actually), how to we engage the new members?
how the plot was made
if you're interested the steps are
- get the info in CSV format from mysql
$ echo "select uid,created from users" | mysql --skip-column-names -u eglug -p eglug | grep -v '^0' | > users.csv
$ echo " select nid,created from node" | mysql --skip-column0names -u eglug -p eglug > node.csv
we filtered out user 0, user 0 is the anonymous user and it has a created value of 0, this will make the plot rang from 1970-2005
- set up gnuplot, make X axis use date data, set time format to second since the epoch
$ gnuplot
> set xdata time
> set timefmt '%s'
- plot the data
> plot "users.csv" using 2:1 , "node.csv" using 2:1
- like what you see? save it to a file
> set terminal png size 800,600
> set out "eglug.png"
> plot "users.csv" using 2:1, "node.csv" using 2:1